
What to Expect in CFA Level 1 Economics
In CFA Level 1 Economics, you will delve into fundamental micro- and macroeconomic principles that are essential for financial and investment analysis. Although Economics carries a weight of 6%-9% on the exam, which is relatively lower compared to Ethics and Financial Statement Analysis, it is equally important. Throughout this course, you will gain insights into crucial aspects of economic forecasting, top-down investment analysis, and bottom-up security selection strategies.
Exam WeightingThe CFA Economics topic has a weighting of 6%-9% of the L1 exam, so approximately 11-16 of the 180 exam questions focus on this topic.
No. of Learning Modules No. of Formulas| No. of Learning Modules | No. of Formulas |
|---|---|
| 8 | ca. 60 |
Level 1 Economics 2026 Syllabus, Learning Modules, and Changes
CFA Level 1 Economics’ syllabus spans 8 learning modules and contains 30learning outcome statements (LOS). The CFALevel 1 exam has minor updates to the overall structure for economics, with some reshuffling in the learning outcomes.
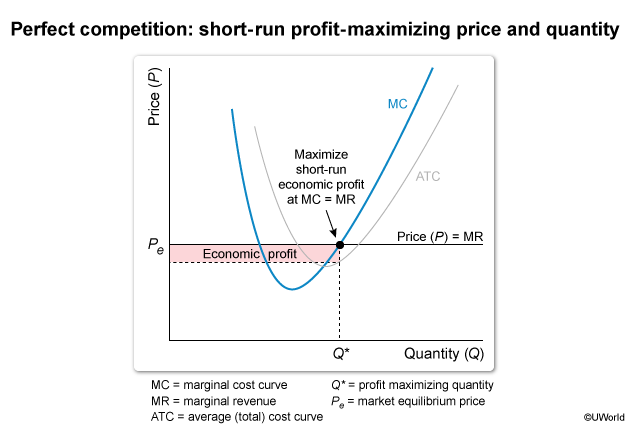
The Firm and Market Structures
Market structures are intimately tied to how firms price their products and their potential profitability. For example, long-term profits are typically decreased in highly competitive markets but still attainable in less competitive markets. Familiarity with the effects of various market forces is a boon to financial analysts when evaluating a firm’s short- and long-term prospects.
- The reading distinguishes between various market structure classifications and how each structure influences the outcomes of demand and supply relations.
- The reading also covers company competition and interaction in various market conditions, such as perfect competition, monopolistic competition, oligopoly, and pure monopoly.
Understanding Business Cycles
Typical business cycles and phases exist within economies despite their complexity. Understanding cycle phases aids the analyst in projecting how outcomes and decisions of individuals and firms affect the performance of sectors and companies.
- The reading familiarizes you with the business cycle and its phases and how various economic factors fluctuate accordingly.
- The reading also elaborates on methods to interpret a set of economic indicators and covers measurements of inflations.

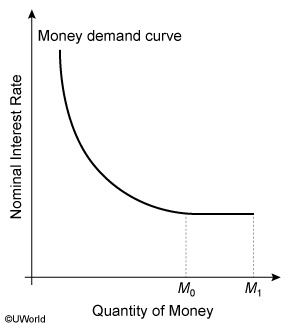
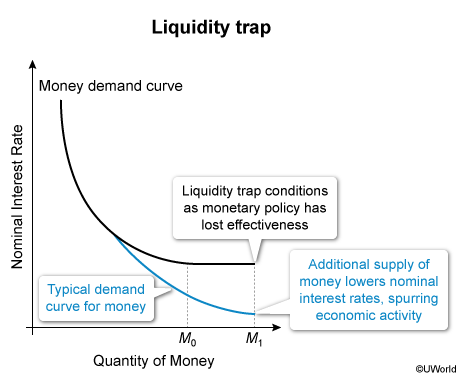
Monetary and Fiscal Policy
Governments in developed countries have an outsized impact on their economies due to the size of the workforce they employ and of their fiscal budgets. This influence is augmented by taxation and spending decisions (fiscal policy)and a central bank’s influence over credit and the quantity of money (monetary policy).
- The reading introduces how money is created, the role of central banks, and various theories regarding the demand for and supply of money.
- The reading also distinguishes between expansionary and contractionary monetary policies and the advantages and disadvantages of various tools for implementing fiscal policies.
Introduction to Geopolitics
Geopolitics is closely related to globalization, as the interconnectedness of the world’s economies and political systems has increased in recent decades. This has led to cooperation and competition between countries as they seek to advance their own interests in an increasingly interconnected world.
- The reading analyzes geopolitics from the perspective of cooperation versus competition.
- The reading also assesses geopolitics and its relationship with globalization, explores tools of geopolitics and their impact on regions and economies, and analyzes geopolitical risk and its impact on investments.
International Trade and Capital Flows
The attractiveness of a global investment may depend on a particular country’s economic robustness, price stability or interest rates, the strength of a specific sector or industry, GDP growth rates, trade policies, demographics, human capital, etc.
- The reading explores the benefits of international trade and describes the dynamics of trading blocs, common markets, and economic unions.
- The reading also explains how international financial organizations influence and facilitate international trade and the implications of various trade and capital restrictions.
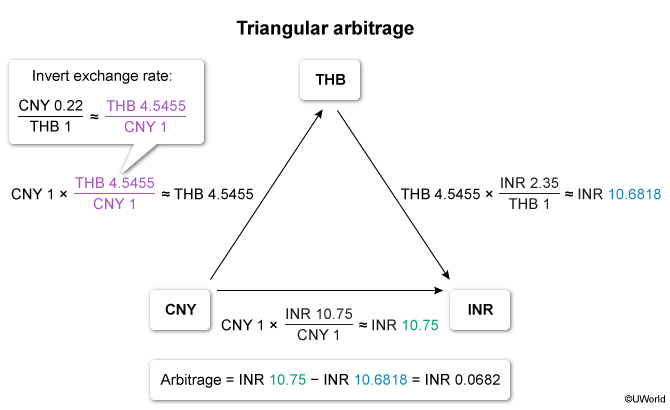
Currency Exchange Rates
The global economy is becoming increasingly interwoven, and this integration is impossible without currency exchange. As a result, the foreign exchange market (FX) is the largest market on the planet. Furthermore, purely domestic portfolios are not exempt from the influences of globalization, making an understanding of foreign exchange critical for any financial analyst.
- The reading explores exchange rate mechanics and familiarizes with major players.
- The reading also covers alternative exchange rate regimes and how exchange rates influence a country’s imports, exports, and capital flows.
CFA Economics Level 1 Sample Questions and Answers
These sample questions are typical of the probing multiple-choice questions on the L1 exam. During the exam, you have about 90 seconds to read and answer each question, carefully designed to test knowledge from the CFA Curriculum. UWorld’s question bank will expose you to exam-like questions and thoroughly illustrate the concepts tested.
What to Expect in CFA Level 2 Economics?
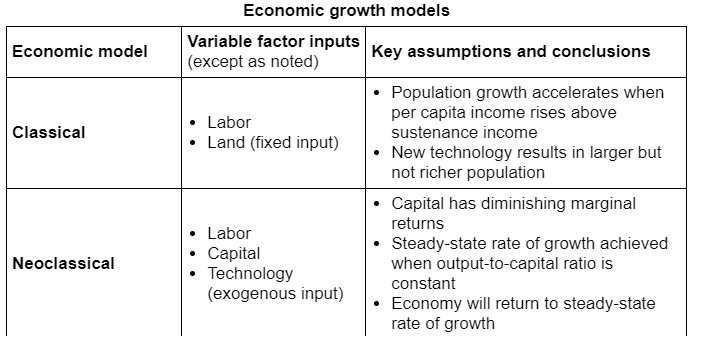
At 5-10% of the total exam content, CFA Level 2 Economics is less heavily weighted than about half of the topics on the Level 2 exam and contains only 1 study session. The topic readings focus on foreign exchange concepts and theories of exchange rate determination. You will explore 3 theories of growth and how regulation affects particular industries.
Exam Weighting
The CFA Economics topic has a weighting of 5-10% of the L2 exam content, meaning that approximately 4-8 item set questions or 1-2 item sets focus on this topic.
| No. of Learning Modules | No. of Formulas |
|---|---|
| 3 | ca. 50 |
Level 2 Economics 2026 Syllabus, Readings, and Changes
The CFA Level 2 Economics syllabus will remainthe same in 2026 and has no substantive changes from prior readings.
| No. of Learning Modules:3 | No. of LOS :34 |
|---|---|
|
Introduces fundamental foreign exchange concepts and theories of exchangerate determination.Discusses 3 theories of growth and concludes with an overview of the regulation and its effecton industries. |
|
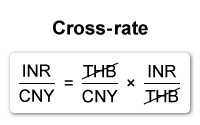
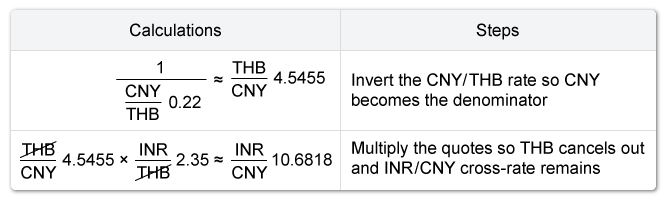
Currency Exchange Rates: Understanding Equilibrium Value
Exchange rate fluctuations are known to be unpredictable. Therefore, financial analysts are better off understandinglong-run equilibrium value, risk exposure, and currency hedges.
- The reading reviews fundamental theories and important influences regarding currency equilibrium dynamics.
- The reading also explores international parity conditions and how to calculate important variables related tolong-term currency value.
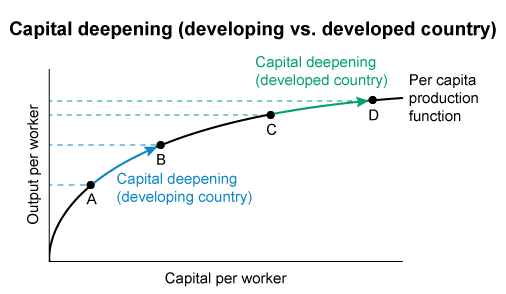
Economic Growth
Global investors are concerned with forecasts of long-term economic growth. To develop global portfolio strategies,investors must become familiar with identifiers of long-term sustainable growth. You will explore factors that drivelong-term growth and that may be predictive of success or failure.
- The reading discusses the possibility of developing countries catching up with developed countries in thelong-run and how policies affect sustainable growth rates.

Economics of Regulation
Regulations are developed and implemented when market solutions can’t adequately address an issue. These regulationsinfluence national economies, companies, and individuals.
- The reading discusses the reasoning behind regulation, its role in ensuring market fairness, and its costs andbenefits.
- The reading also reveals the tools regulators use domestically and internationally.
CFA Economics Level 2 Sample Questions and Answers
These sample questions mirror the complexity and depth of the Level 2 exam. They are presented as item sets,accompanied by a vignette, which assesses your knowledge of the CFA Level 2 Curriculum. Please note that eachvignette corresponds to 4 questions on the actual exam. We have included a few extra questions to enhance yourlearning experience.
Make sure to review the detailed answer explanations provided for each question. UWorld’s question bank willfamiliarize you with exam-style questions and provide comprehensive explanations for the tested concepts.

What to Expect in CFA Level 3 Economics?
CFA Level 3 does not include a dedicated stand-alone Economics topic area, but Economics concepts still appear within Portfolio Management, Capital Market Expectations, global macro analysis, currency management, and scenario-based constructed-response questions.