What to Expect in CFA Level 1 Financial Statement Analysis?
The CFA Level 1 Financial Statement Analysis (FSA), formerly known as Financial Reporting and Analysis (FRA), is the second most weighty topic on the CFA exam after Ethics. FSA is fundamental not only to passing Level 1 but also to succeeding in the CFA Program overall. 20% of Level 1 readings are dedicated to the topic and cover a breadth of financial accounting knowledge. Candidates will study the various components of financial statements, how to assess their quality, and how to adjust data to improve their analysis and thus value companies and assets more accurately.
Exam Weighting
The CFA Financial Statement Analysis has a weight of 11-14%, so approximately 20-25 of the 180 CFA Level 1 exam questions focus on this topic.
| Topic Weight | No. of Learning Modules | No. of Formulas | No. of Questions |
|---|---|---|---|
| 11-14% | 12 | Nearly 100 | ca. 25 |
Level 1 Financial Statement Analysis Syllabus, Readings, and Changes
The CFA Level 1 exam for 2024 comprises 12 Learning Modules, mirroring the structure of the 2023 exam. Notably, this year introduces “Introduction to Financial Statement Modeling” and divides the Cash Flow section into two smaller readings. Financial Reporting Standards have been integrated into the introductory reading, marking a change from the previous format.
Introduction to Financial Statement Analysis
This first reading of Financial Statement Analysis introduces financial reporting roles and how to use various financial statements to evaluate a company’s performance and financial position. The reading also covers the importance of financial statement notes, the objective of audits, and information sources used by analysts.
Understanding Income Statements
Covers the components of the income statement and general principles and accounting standards for revenue and expense recognition. The reading also includes how earnings per share (EPS) is calculated and interpreted and the fundamentals of non-recurring items in financial analysis.
Understanding Balance Sheets
Provides detailed descriptions of balance sheet items (assets, liability, equity) and the uses and limitations of the balance sheet in financial analysis. The reading also contrasts current and noncurrent assets/liabilities and demonstrates how to calculate and interpret liquidity and solvency ratios.
Understanding Cash Flow Statements I and II
Cash flows from operating, investing, and financing activities are compared, contrasted, and classified. The readings detail how the cash flow statement is linked to the income and balance sheets and introduce several analytical ratios.
Inventories
Costs included in inventories are contrasted with costs counted as expenses. The reading explains important inventory valuation methods like FIFO and LIFO, the LIFO reserve and liquidation, and their relation to financial statements and ratios.

Long-Lived Assets
Details the difference between tangible and intangible assets, depreciation and amortization methods, and impairment, revaluation, and derecognition of long-term assets. The reading also covers finance and operating leases.
Non-Current (Long-Term) Liabilities
Covers financial statement presentation, disclosures, and derecognition of debt, as well as treating debt covenants in protecting creditors. The reading also includes descriptions of the effective interest method and how to calculate interest expense, amortization of bond discounts/premiums, and interest payments.
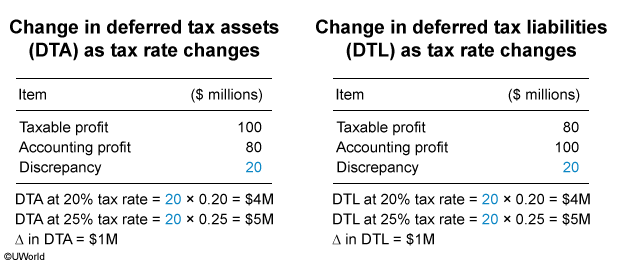
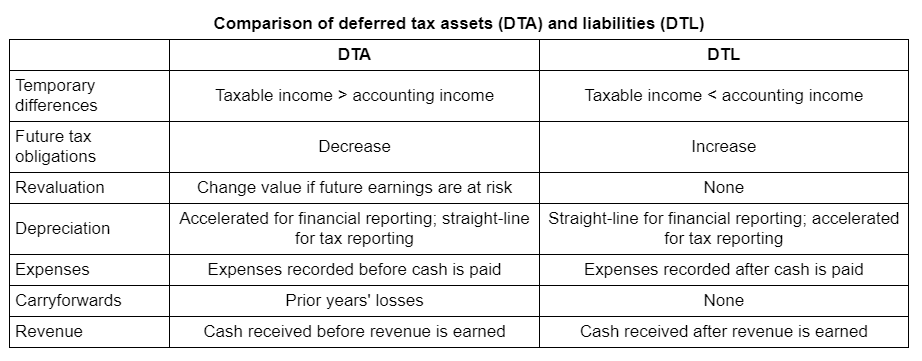
Income Taxes
Defines and distinguishes accounting profit and taxable income and the resulting deferred tax assets or liabilities, or valuation allowance. This is an essential reading as the material is typically less familiar to candidates.
Financial Reporting Quality
Provides tips on distinguishing between conservative and aggressive accounting and identifying the conditions that can lead to low-quality or fraudulent financial reports. The reading also details accounting methods for managing earnings, cash flow, and balance sheet items.
Financial Analysis Techniques
Covers tools and techniques used to analyze companies. The reading is highly theoretical and includes an overview of methods used to identify, calculate, and interpret activity, liquidity, solvency, profitability, and valuation ratios.
Introduction to Financial Statement Modeling
Candidates will learn to develop a sales-based pro forma company model and address behavioral factors’ impact on analyst forecasts. The course explores how a company’s competitive position, analyzed through Porter’s five forces, influences prices and costs. Additionally, candidates will gain expertise in forecasting sales and costs amid price inflation or deflation, with insights into choosing forecast horizons and extending projections beyond the short term.
CFA Financial Statement Analysis Level 1 Sample Questions and Answers
The sample questions are typical of the probing multiple-choice questions on the L1 exam. During the exam, you have about 90 seconds to read and answer each question, carefully designed to test knowledge from the CFA Curriculum. UWorld’s CFA exam prep is built to expose you to exam-like questions and illustrate and explain the concepts tested thoroughly.
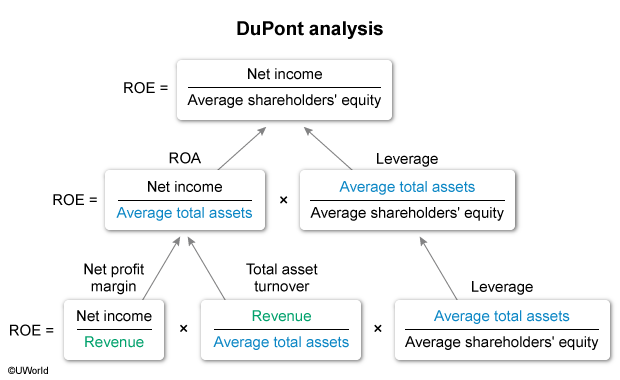
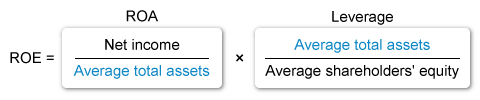
Return on equity (ROE) measures the profitability generated per unit of equity invested. Simply defined, ROE is the ratio of net income to average shareholders’ equity. DuPont analysis subdivides ROE into five underlying components: tax burden, interest burden, profitability, efficiency, and leverage. ROE can be expressed as the product of the company’s return on assets (ROA) and leverage since profitability can be enhanced by using leverage.
| ROA | Leverage | |||
| ROE = |
Net income
/
Average total assets
|
x |
Average total assets
/
Average shareholders’ equity
|
|
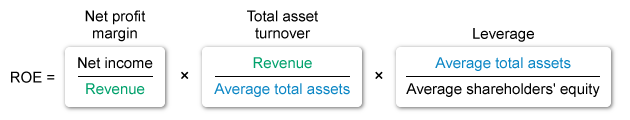
ROE can be further subdivided using the components of ROA, the product of net profit margin and total asset turnover. This form of ROE calculation is often referred to as the three-factor model.
| Net profit margin | Total asset turnover | Leverage | ||||
| ROE = |
Net income
/
Revenue
|
x |
Revenue
/
Average total assets
|
x |
Average total assets
/
Average shareholders’ equity
|
|
In this instance, ROE increased during the period 20X5 to 20X7. Since ROE is the product of ROA and leverage, and ROA decreased, leverage must have increased to result in an increase of ROE.
(Choice B) Since ROA decreased while net profit margins remained stable (given), total asset turnover must have decreased. Specifically, average total assets increased.
(Choice C) A rise in ROE with stable net income could only occur if average shareholders’ equity decreased.
Things to remember:
Return on equity (ROE) measures the profitability generated per unit of equity invested. Simply defined, ROE is the ratio of net income to average shareholders’ equity. DuPont analysis subdivides ROE into five underlying components: tax burden, interest burden, profitability, efficiency, and leverage. ROE can be expressed as the product of the company’s return on assets and leverage.

What to Expect in CFA Level 2 Financial Statement Analysis?
CFA Level 2’s Financial Statement Analysis (FSA) is a pivotal and weighty subject, integral not only to Level 2 success but overall CFA proficiency. Candidates delve into a more nuanced exploration of concepts and principles introduced in Level 1 FSA, underscoring its significance in building a robust foundation for CFA achievement.
Exam Weighting
The CFA Level 2 Financial Statement Analysis has a weight of 10%-15% on the L2 exam, meaning that approximately 8-12 of the 88 CFA Level 2 exam questions or 2-3 item sets focus on this topic.
| Topic Weight | No. of Learning Modules | No. of Formulas | No. of Questions |
|---|---|---|---|
| 10-15% | 7 | Nearly 40 | ca. 8-12 or 2-3 item sets |
Level 2 Financial Reporting Analysis Syllabus, Readings, and Changes
The CFA Level 2 exam includes 7 Learning Modules for 2024, of which Financial Statement Modeling reading which was previously Industry and Company Analysis, has a minor revision in which a reading moved from Equity Valuation topic to FSA.
Intercorporate Investments
Describes the classification, measurement, and disclosure under International Reporting Standard (IFRS) for various investments and compares and contrasts to US GAAP. The reading also covers the effect of various accounting methods for intercorporate investments on financial statements and ratios.
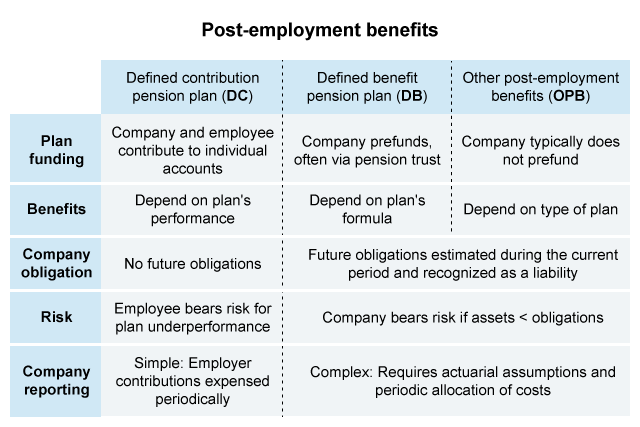
Employee Compensation: Post-Employment and Share-Based
Look at strategies to explain and calculate measures of a defined benefit pension obligation, the effect of a defined benefit plan’s assumptions on the defined benefit obligation and periodic pension cost, and the effect of adjusting for pension items and other post-employment benefits reported in financial statement notes on financial statements and ratios.
Multinational Operations
Covers foreign currency transaction exposure, how currency fluctuations affect financial results, and how a company’s effective tax rate is affected by multinational operations. The reading also compares and contrasts presentations in reporting various currencies and the current rate and temporal methods.
Analysis of Financial Institutions
Describes the differences between financial institutions and companies and key aspects of financial institutions’ financial regulations. The reading also explains various approaches to analyzing banks, including the capital adequacy, asset quality, management, earnings, and liquidity and sensitivity (CAMELS) approach.

Evaluating Quality of Financial Reports
Demonstrates conceptual frameworks for assessing financial report quality (balance sheets, cash flow, etc.), including identifying potential issues that negatively affect quality. The reading also explains mean reversion in earnings and how the accrual component of earnings affects the speed of mean reversion.Integration of Financial Statement Analysis Techniques
Demonstrates frameworks for analyzing particular problems within financial statements (e.g., critiquing a credit card rating, valuing equity based on comparables, etc.). The reading also covers evaluating financial and reporting biases in the quality of a company’s financial data and recommends appropriate adjustments to improve quality and comparability with similar companies.Financial Statement Modeling
It focuses on the complexities of modeling pro forma financial statements and includes additional material on behavioral biases in forecasting.CFA Financial Statement Analysis Level 2 Sample Questions and Answers
The sample questions here are typical of the L2 exam’s complexity and depth: formatted as item sets, with a vignette to deliver a scenario that tests the CFA L2 Curriculum. (On the actual exam, each vignette applies to four questions; we’ve thrown in a couple extra to get a bit more learning in). And be sure to review the illustrated explanations we’ve provided for each question: UWorld’s question bank is designed to expose you to exam-like questions and explain the concepts tested thoroughly.
Passage
Lang & Bauer Group (LBG) is a German company that reports using IFRS. LBG has two retirement benefit plans: a defined contribution plan, open to all employees, and a defined benefit plan, closed to new participants.
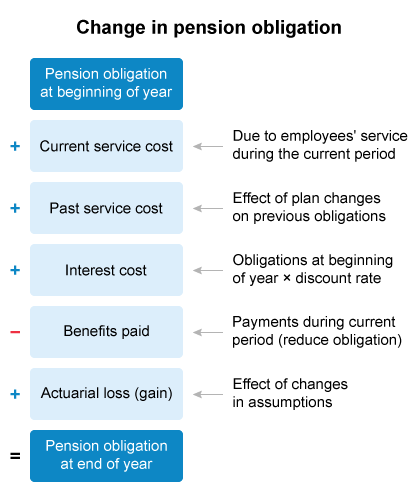
LBG’s chief executive officer, Emma Schuster, asks the chief financial officer, Jan Berger, to outline the current situation of the company’s retirement benefit plans. Berger explains that the plans have distinct features, and although the accounting treatment of the defined contribution plan is relatively simple, the defined benefit plan requires a more detailed analysis. Berger presents the following information from the defined benefit plan:
| Exhibit 1 Lang & Bauer Retirement Plan Information | |
|---|---|
| (EUR millions) | 20X8 |
| Discount rate assumption | 5.00% |
| Current service costs | 1,250 |
| Past service costs | 850 |
| Actuarial loss (gain) | 200 |
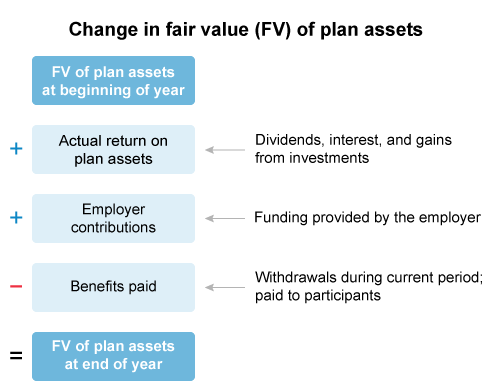
| Employer contribution | 2,300 |
| Benefits paid | 1,800 |
| Actual return on plan assets | 900 |
| Pension obligation at beginning of year | 13,000 |
| Fair value of plan assets at beginning of year | 11,400 |
Berger warns Schuster that this information relies on some key assumptions, and that changes in these assumptions would have material effects on the estimates of benefit obligations and periodic pension costs. Berger lists the discount rate, the annual compensation growth, and life expectancy as some of these key assumptions.
Schuster asks Berger to prepare a comparison with defined benefit plans of LBG’s peers in Europe and in the United States. Berger explains that, since US companies comply with US GAAP, there are several differences in the way that pension costs are recognized in the profit and loss (P&L) and other comprehensive income (OCI) statements. Schuster asks Berger to provide examples of how the accounting treatment under US GAAP differs from the treatment under IFRS. Berger states that under US GAAP:
Example 1: Actuarial losses (gains) recognized in OCI are not subsequently amortized to P&L.
Example 2: The effects of plan amendments on obligations for prior services are recognized in P&L.
Example 3: Differences between actual and expected return on assets result in an actuarial loss or gain.
What Is the CFA Level 3 Financial Statement Analysis?
There is no distinct readings for CFA Level 3 Financial Statement Analysis. It is one of several foundational topics that the CFA Level 3 exam tests implicitly while focusing on Portfolio Management.