What to Expect in CFA Level 1 Equity Investments?
This section delves into the critical insights and methodologies employed in formulating investment recommendations and decisions. It centers on the principles of fundamental analysis, a cornerstone in determining investment choices. The course provides an in-depth exploration of techniques used to estimate a company’s intrinsic value. Additionally, it offers insights into the workings of an effective financial system, addressing topics like market efficiency and diverse strategies for appraising both public and private equity.
The Equity Investments (EI) module represents a significant Level 1 CFA examination component. Mastery of this topic is pivotal for excelling in the initial stage and crucial for overall success in the CFA Program.
Exam Weighting
The CFA Institute’s Level I Equity Investments topic has an exam weight of 11-14% of the total exam content, so approximately 20-25 of the 180 CFA Level 1 exam questions focus on this topic.
| Topic Weight | No. of Learning Modules |
No. of Formulas |
No. of Questions |
|---|---|---|---|
| 11-14% | 8 | Nearly 15 | 20-25 |
Level 1 Equity Investments Syllabus, Readings and Changes
The CFA Level 1 Equity syllabus encompasses eight learning modules with a total of 66 LOS. Noteworthy changes for 2024 include the expansion of Company Analysis into two distinct modules and the enhancement of Industry Analysis to incorporate Competitive Analysis.
| No. of Learning Modules: 8 | No. of LOS: 66 | |
|---|---|---|
|
Summary
A structural overview of financial markets and their operating characteristics is provided. Overview includes markets for equities, fixed income, derivatives, and alternative investments. Various asset types, market participants, and types of trades within these markets and ecosystems are described. The calculation, construction, and use of security market indexes are discussed together with market efficiency: how well market prices reflect available information. |
||
Market Organization and Structure
This reading provides an overview of various types of markets and the actors who participate in them. The overview includes markets for equities, fixed income, derivatives, and alternative investments.
Security Market Indexes
This reading focuses on different types of indexes, how they are constructed, and what they are used for.
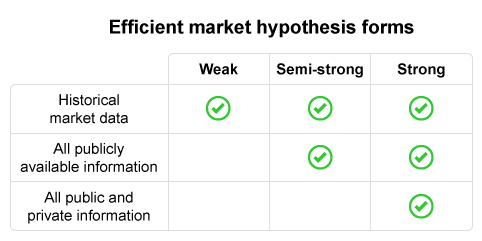
Market Efficiency
This reading presents a detailed discussion on whether and/or how effectively market prices reflect the intrinsic value of securities.
Overview of Equity Securities
This reading provides a qualitative analysis of the features that distinguish equity securities from other asset classes and their roles in the capital markets.
Company Analysis: Past and Present
This course prioritizes “Company Analysis: Past and Present,” equipping candidates to articulate elements in a research report, determine a company’s business model, and evaluate revenue factors such as pricing power. It also guides the assessment of operating profitability, working capital efficiency, and insights into financial decision-making regarding capital investments and structure.
Industry and Competitive Analysis
Focused on “Industry and Competitive Analysis,” this course equips candidates to articulate analysis purposes and steps. It covers industry classification methods, sizing, growth, profitability trends, and market share. Analyzing industry structure and external factors is emphasized, employing Porter’s Five Forces and PESTLE. Candidates will also evaluate competitive strategy and company positioning.
Company Analysis: Forecasting
Candidates will learn principles and approaches for forecasting a company’s financials, including revenue, operating expenses, and capital structure. The course also explores the strategic use of scenario analysis in forecasting.
Equity Valuation: Concepts and Basic Tools
Candidates will learn to evaluate securities, categorize equity valuation models, and calculate intrinsic values using discount models and price multiples. Additionally, the course covers understanding dividend structures, including regular and extra dividends, stock dividends, stock splits, reverse stock splits, and share repurchases. The use of enterprise value multiples and asset-based valuation models for estimating equity value is also explored.
For a more comprehensive discussion visit the CFA Level 1 syllabus page.

CFA Equity Investments Level 1 Sample Questions and Answers
The sample questions are typical of the probing multiple-choice questions on the CFA L1 exam. During the exam, you have about 90 seconds to read and answer each question, carefully designed to test knowledge from the CFA Curriculum. UWorld’s question bank is built to expose you to exam-like questions and illustrate and explain the concepts tested thoroughly.
What to Expect in CFA Level 2 Equity Valuation?
The CFA Level 2 Equity Valuation (EV) curriculum, formerly known as CFA Equity Investments (EI), is one of the more heavily weighted topics, with 6 learning modules dedicated to EV. This topic is not only fundamental to passing Level 2 but succeeding in the CFA overall. Candidates will dive deeper into the details the concepts and principles presented in the Level 1 curriculum.
Exam Weighting
The CFA Equity Valuation weighs 10-15% of the total exam content so that approximately 8-12 questions or 2-3 item sets of the CFA Level 2 exam focus on this topic.
| Topic Weight | No. of Learning Modules | No. of Formulas | No. of Questions |
|---|---|---|---|
| 10-15% | 6 | Around 100 | 8-12 |
Level 2 Equity Valuation Syllabus, Readings, and Changes
The data, examples, and references in all six learning modules in the Equity Valuation topic area have been refreshed, but the readings’ content remains unchanged. For a more comprehensive discussion of LOS visit the official CFAI Level 2 Curriculum Changes page.
| No. of Learning Modules: 6 | No. of LOS: 76 | |
|---|---|---|
|
Summary
The course begins with fundamental equity valuation concepts, exploring value definitions and application of models. Key return measures, including equity risk premium and derived required return, are discussed. Models like discounted cash flow (DCF) and the dividend discount model (DDM) are covered, with a focus on alternative methods like the free cash flow model. Relative valuation, using multiples, and residual income valuation are explored. The session concludes with approaches for valuing private company equity. |
||
Equity Valuation: Applications and Processes
This reading discusses the various definitions of value and the application of equity valuation techniques. A five-step equity valuation process is described with the presented three main categories of equity valuation models (absolute, relative, and total entity).
Discounted Dividend Valuation
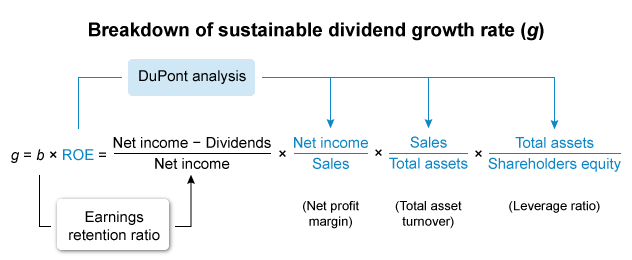
This learning module explains the calculation and interpretation of the value of common stock using the dividend discount model (DDM) and the Gordon growth model for single and multiple holding periods. It explains the models’ underlying assumptions, interprets the implied growth rate of dividends, and compares intrinsic value and the market value based on the DDM.
Free Cash Flow Valuation
This learning module compares the free cash flow to the firm (FCFF) and free cash flow to equity (FCFE) approaches to valuation. It describes approaches for forecasting FCFF and FCFE and compares the FCFE model and dividend discount models. This reading also explains the single-stage (stable-growth), two-stage, and three-stage FCFF and FCFE models and justifies the selection of the appropriate model given a company’s characteristics. It then describes how to estimate a company’s value using the appropriate free cash flow model.

Market-Based Valuation: Price and Enterprise Value Multiples
This learning module provides contrast on the valuation methods based on comparables and on forecasted fundamentals as approaches to valuation and explains economic rationales for each approach. The discussion includes rationales for and possible drawbacks to using alternative price multiples and dividend yield in estimates of intrinsic value.
Residual Income Valuation
This learning module describes, calculates, and interprets residual income and its uses in estimating the common stock’s intrinsic value, especially compared to other approaches. It explains the fundamental determinants of residual income and discusses the strengths and weaknesses of residual income models, including accounting issues in residual income model applications.
Private Company Valuation
This learning module describes issues of private business valuation. It explains the cash flow estimation issues and adjustments required to estimate normalized earnings and calculate the value of a private company using different approaches. Also included are discussions of the effects of discounts and premiums based on control and marketability on private company valuations.
CFA Equity Valuation Level 2 Sample Questions and Answers
The sample questions here are typical of the L2 exam’s complexity and depth: formatted as item sets, with a vignette to deliver a scenario that tests the CFA L2 Curriculum. (On the actual exam, each vignette applies to four questions; we’ve thrown in a couple extra to get a bit more learning in). And be sure to review the illustrated explanations we’ve provided for each question: UWorld’s question bank is designed to expose you to exam-like questions and explain the concepts tested thoroughly.
Passage
Bruno Martins is a senior sell-side analyst covering the technology, media, and telecom sectors. He is meeting with Mariana Dias, one of his junior analysts, to discuss valuing companies using their forecasted dividends. All dividends are assumed to be paid annually at the end of the year.
Dias is currently analyzing Terra Manufacturing and Oceano Technologies. Both companies have a stable ROE of 12%, a stable capital structure, no changes to their common stock outstanding, and a constant dividend payout ratio. However:
- Terra’s payout ratio is 60% and
- Oceano’s payout ratio is 45%
It is the beginning of 20X3, and Dias has the following forecast for Oceano’s dividends:
| Exhibit 1 Dividend Forecast for Oceano (in BLR) | |
|---|---|
| Year | Dividend per share |
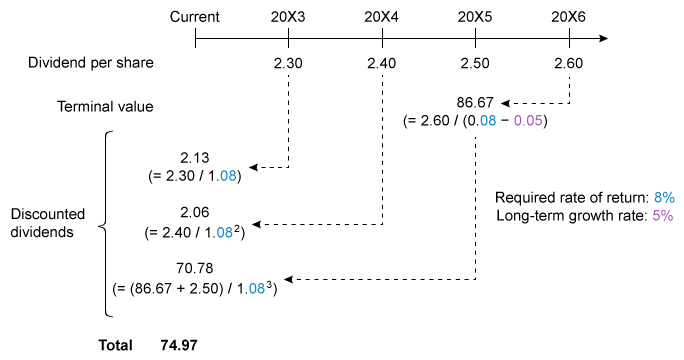
| 20X3 | 2.30 |
| 20X4 | 2.40 |
| 20X5 | 2.50 |
| 20X6 | 2.60 |
Martins is valuing Oceano based on a three-year holding period and given a required rate of return of 8%. Dias uses two methods:
Method 1: Using the Gordon growth model to estimate the terminal value, Dias expects Oceano’s dividend to grow at a constant 5% rate starting in 20X6.
Method 2: Using P/E to estimate the terminal value, Dias expects Oceano’s justified forward P/E ratio at the end of 20X5 to be 11x.
Martins is analyzing three other companies and asks Dias to generate dividend expectations for each. Dias provides the following:
| Exhibit 2 Dividend Expectations for Three Companies | ||
|---|---|---|
| Ticker | Industry | Dividend Forecast |
| LIFE | Technology | 20X3: Dividend per share = BRL 3.80 20X4 and 20X5: Annual dividend growth rate = 3% 20X6: Make acquisition and suspend dividend 20X8: Pay specialdividend per share = BRL 8.00 20X9: Reinstate normal dividend Dividend growth thereafter = 4% |
| FAIR | Telecom | 20X3: Dividend per share = BRL 2.00 20X4 and 20X5: Dividend growth = 12% 20X6 and 20X7: Dividend growth = 7% Dividend growth thereafter = 4% |
| VOYG | Media | 20X2: Dividend per share = BRL 1.50 and dividend grew 8% 20X3: Transition to mature growth phase over 8 years Dividend will grow 3% in mature growth phase |
Martins estimates the risk-free rate at 3% and equity risk premium at 5%. He believes a stock would be over- or undervalued if it’s more than 8% from its calculated intrinsic value to allow for uncertainty in the model.
What to Expect in CFA Level 3 Equity ‘Portfolio Management’?
CFA Level 3 Equity Portfolio Management explains the role equity investments play in portfolios, considering costs and shareholder responsibilities. It then discusses two approaches to equity portfolio management: passive (e.g., index-based) investing and active equity strategies. There is a detailed discussion of quantitative and fundamental equity strategies, including each investment approach’s underlying rationale and portfolio design process.
A total of 4 out of the 35 (11.4%) Level 3 readings are dedicated to Equity. Candidates will dive deeper into the details of the concepts and principles presented at Level 2.
Exam Weighting
The Level 3 CFA Equity Valuation topic weighs 10-15% of the total exam content, so approximately 11 of the 88 CFA Level 3 exam questions focus on this topic. Each item on the 2024 CFA Level 3 exam will have a vignette with essay or multiple-choice questions.
| Topic Weight | No. of Readings | No. of Formulas | No. of Questions |
|---|---|---|---|
| 10-15% | 4 | Around 30 | 11 |
Level 3 Equity Investments Syllabus, Readings and Changes
The CFA Level 3 exam includes 4 total readings for 2024, with about 28 learning outcomes that focus on passive equity investing, index replication, and portfolio construction.
| No. of Readings | No. of LOS | |
|---|---|---|
| 4 | 28 | |
|
Summary
This session outlines the role of equity investments in portfolios, covering passive and active strategies. It explores issues in passive equity investing, including index replication approaches and factor-based strategies. The discussion includes tracking error considerations and examines quantitative and fundamental equity strategies. Factor-based investing and specialized strategies like activist investing are explored. The study concludes with insights into active equity portfolio construction, addressing aspects such as active share, risk budgeting, and constraints. |
||
Overview of Equity Portfolio Management
This reading describes the roles of equities in the overall portfolio. It covers the types of income and costs associated with owning and managing an equity portfolio and their potential effects on portfolio performance and describes rationales for equity investment across the passive-active spectrum.
Passive Equity Investing
This reading covers considerations in choosing a benchmark for passively managed portfolios and issues such as alternative approaches to index replication and factor-based passive strategies. Tracking error, risk, and return considerations from an indexing perspective are also discussed.

Active Equity Investing: Strategies
This reading compares fundamental and quantitative approaches to active management and analyzes bottom-up and top-down active strategies, including their rationales and associated practices. It describes how fundamental active investment and quantitative active investment strategies are created.
Active Equity Investing: Portfolio Construction
This reading discusses elements of a manager’s investment philosophy that influence the portfolio construction process and approaches for constructing actively managed equity portfolios. The uses of risk budgeting and risk measures incorporated in equity portfolio construction are presented. Discuss issues important in active equity portfolio construction, including active share, active risk, risk budgeting, and constraints on portfolio construction.